Democrats Gain Nearly 11,000 Voters in Hudson Valley in Past Year
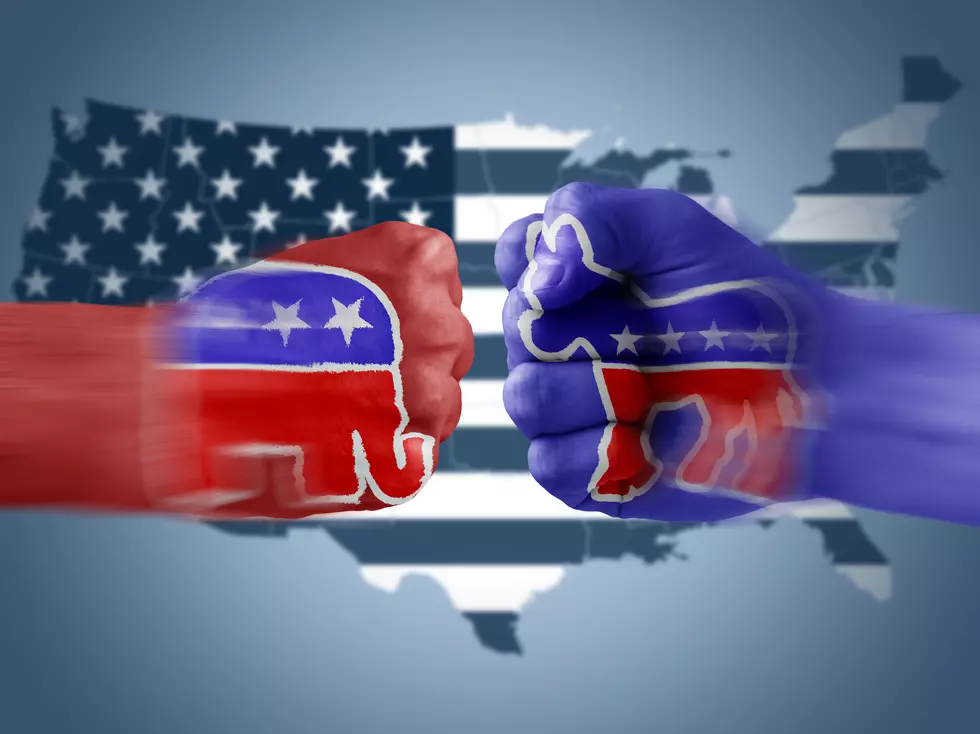
The most up to date voter registration numbers show the Hudson Valley is gaining lots of Democrats and losing many Republicans.
Below is the number of registered voters in the Hudson Valley on Nov. 1, 2018, and Nov. 1, 2019, according to the New York State Board of Elections.
Voters Registered as of November 1, 2018:
- Columbia County: Dem. 16,908/Rep. 12,585
- Dutchess County: Dem. 70,946/Rep. 56,481
- Orange County: Dem. 88,509/Rep. 75,554
- Putnam County: Dem. 20,572/Rep. 23,856
- Rockland County: Dem. 96,909/Rep. 48,644
- Sullivan County: Dem. 19,903/Rep. 14,697
- Ulster County: Dem. 49,472/Rep. 30,067
- Westchester County: Dem. 313,536/Rep. 139,646
- Total: Dem. 676,755/Rep. 401,530
Voters Registered as of November 1, 2019
- Columbia County: Dem. 17,902/Rep. 12,660
- Dutchess County: Dem. 72,415/Rep. 55,463
- Orange County: Dem. 89,720/Rep. 74,158
- Putnam County: Dem. 21,052/Rep. 23,549
- Rockland County: Dem. 96,933/Rep. 48,053
- Sullivan County: Dem. 20,207/Rep. 14,918
- Ulster County: Dem. 52,454/Rep. 30,158
- Westchester County: Dem. 317,018/Rep. 133,872
- Total: Dem. 687,701/Rep. 392,771
Totaling up all that data in the past year, there are 10,946 more Democrats in the Hudson Valley and 8,759 less Republican in the Hudson Valley, according to data released by the New York State Board of Elections.
Dutchess, Orange, Putnam, Rockland and Westchester counties all saw an increase in Democrats and a decrease in Republicans
Ulster, Sullivan and Columbia counties saw an increase in both.
- Freezing Temperatures, Chance of Snow Forecast For Hudson Valley
- Democrats Gain Nearly 11,000 Voters in Hudson Valley in Past Year
- Local Farm Owned by Granddaughter of 'The Wizard of Oz' Producer
- Man Fatally Shot at Hudson Valley Restaurant, Shooter At Large
- Hudson Valley Man Gunned Down Near School, Suspects on Run
- Hudson Valley Fire Department Board Member Charged With Murder
- Popular Hudson Valley Bar Closed For Movie Filming
- Anti-White Supremacy Rally Held in Hudson Valley
More From Hudson Valley Post


